
State decision making about “opportunity zones” presents an opportunity for NIU’s Center for Governmental Studies to develop new mapping capabilities

Andy Blanke
Andy Blanke, a research specialist in NIU’s Center for Governmental Studies recently partnered with the Illinois Department of Commerce and Economic Opportunity (DCEO) to create an interactive map to aid the department’s decision-making process about federal Opportunity Zones. We spoke with Andy to learn more about Opportunity Zones, and to find out how CGS’s interactive map is helping Illinois policy makers make informed decisions.
What are opportunity zones? What should we know about them?
It’s a federal program by the Department of Housing and Urban Development. It’s meant to improve housing development in economically distressed areas. The federal government has determined a threshold for which census tracts or which parts of the states could receive these housing incentives, but then states have discretion to determine, out of all the census tracts that are eligible, which ones will actually get that designation.
In the State of Illinois, there are a little under 1,000 census tracts that meet the baseline federal eligibility. But states can only designate a subset of those, which will be roughly 200 in Illinois. The DCEO is making recommendations to the governor, so they want to make sure they’re picking the best census tracts – where the housing incentives are needed and would make a positive difference.
Can you tell us about the map you worked on, and how that helps with decision making?
With the map, I helped the DCEO look at other considerations besides just, are the tracts low income? They wanted to know things like, are there census tracts that are close to a major business or employer? Are there places that might have synergies with other grant and investment programs? Are there census tracts close to an institute of higher education where they might be able to do something with workforce development?
The problem is, since there are almost 1,000 census tracks that are potentially eligible, nobody wants to be sifting through an Excel spreadsheet with 1,000 rows trying to eyeball it! That sort of thing makes a lot more sense on a map.
So that’s where I’ve helped the DCEO with this. I’ve developed an online mapping application that shows all the census tracts that are eligible, and then it overlays some other data considerations, so they can flip a switch and it will show where all the different addresses are, where there has been a grant or an incentive program from DCEO, such as the Clean Energy Jobs Act Workforce Hubs Program. Where there are already projects funded by Community Development Block Grants, or where there are shovel-ready building sites available. These are just a few examples of the types of data I included on the map layers. I tried to make it as easy as possible for the Department of Commerce and Economic Opportunity folks to see all the data and make informed decisions about where to locate these incentives.
The map also helps them make sure that their selections are representative, so they can pick an even selection of census tracts that are urban or rural, in Chicago versus southern Illinois, western Illinois, across all parts of the state. It makes their selected census tracts a lot more clear, so they can show the governor’s office and the public that they did their homework and have good reasons for choosing certain tracts. For example, suppose the Opportunity Zone program needs to include some communities in Northern Illinois… We’re trying to narrow down which parts of those communities could benefit the most.
Who else did you work with on the project?
Within CGS, I was basically working on my own, although some colleagues did help me beta test it, see if the map made sense the way I presented it. Most of my work on this project was a collaborative effort with the data research people within the Illinois Department of Commerce and their partners.
In the early stages, we also partnered with some data people from the Illinois Housing Development Authority and the Illinois Economic Development Corporation. They gave a lot of input about what sorts of things would be useful to show on the map, what sort of things would be relevant to their decision making. I wanted to make sure this data was actionable for them. I wanted to give them a Dairy Queen Blizzard, not a blizzard of data where you can’t even get your car out of the driveway!
Very cool! Is this map publicly available?
Unfortunately, the policy map I developed is solely for DCEO internally. I also developed a public map of the 240 census tracts nominated by DCEO, which will be published after they make the final announcement.
To help with the community outreach process as DCEO was selecting their tracts, I developed this public reference map: https://experience.arcgis.com/experience/283db94d55164bc09208400be312f8dd/
This map shows all eligible census tracts, along with an address search to see if your community might be eligible.
What do you think municipal and county governments should know about Opportunity Zones and about CGS’s data mapping capabilities?
I think local governments should 100% take advantage of the Opportunity Zone program as these new zones are designated. There’s going to be a lot of potential for new housing development and new community development initiatives if your community includes selected census tracts.
On the CGS side, this project was a great proof of concept of our interactive mapping capacity. I think a lot of people are familiar with seeing us make a nice PDF map of things shaded by county, but we now have so much capability to make things interactive. For example, if you want to see where all the large businesses are within your community and how that
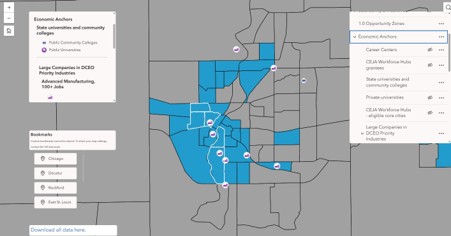
This screenshot demonstrates some of the functionality of the interactive map Andy created for the Department of Commerce and Economic Opportunity.
lines up with the population demographics… How does that line up with these other project sites? What is within a drive time? We have a lot of potential for granularity and making apps more dynamic besides just a static PDF.
Is there anything else you’d like folks to know that we haven’t mentioned?
This has been a really rewarding program for me because I was able to help the Department of Commerce and Economic Opportunity make a successful presentation to the governor’s office about what their policy should be going forward. I was proud to help that policy process go as smoothly as possible. It’s not every day that I can say that the governor looked at a map that I made!